Diagnostics
Sym3 Operator includes some tools that allow diagnostics to be performed while the client is running.
Debug Toolbar
The Debug Toolbar is a useful built-in tool that allows the user access to a number of Diagnostic tools for the Client.

To open the Toolbar use the command ‘Client.Debug.ShowToolbar();’ in the client script.
The values after the title display the mouse co-ordinates in real time. These are based on 0,0 being the top left co-ordinate of the primary display, values decrease moving left and increase moving right. Multiple monitors are supported.
The icons available in the Toolbar are (from left to right):
| Tool | Description |
|---|---|
| Top Most | Brings the Client window to the top (gives it focus) |
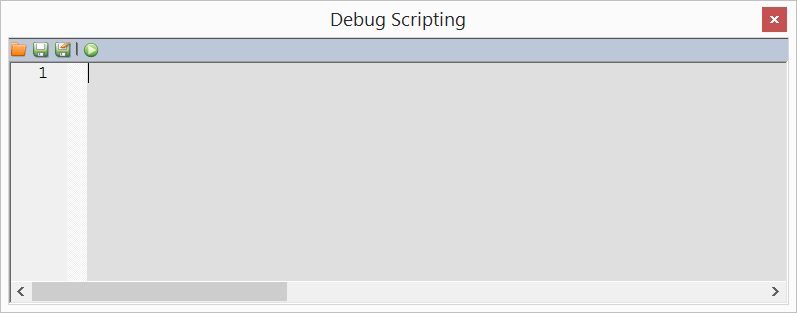
| Open Script Editor | Opens a Script Editor window where scripts can be written and executed (1) Options available in the Script Editor are;
|
| Force Garbage Collection | Launches a process to recover internal memory no longer used |
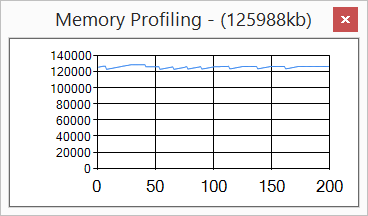
| Memory Profiling | Pop up a Memory usage graph showing real time Memory Usage. (2) The X axis is Profiling time (seconds) and the Y axis is memory used (kb). |
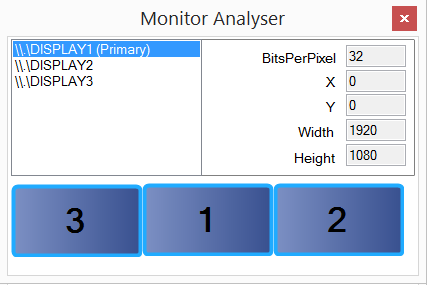
| Monitor Analyser | Shows details on the display monitor(s) in use (3) This show 3 monitors in use in a side-by-side orientation with the color depth and resolutions shown |
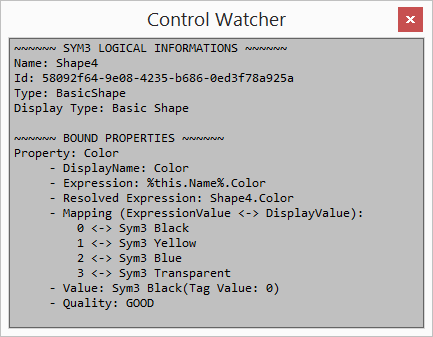
| Animation Watcher | (aka Control Watcher): Displays Tag values, mappings, expressions and Tag quality in real time as the mouse moves over objects in the 3D view.(4) |
| Display Visual Tree | Shows a display tree with a Animatable Properties (5) |
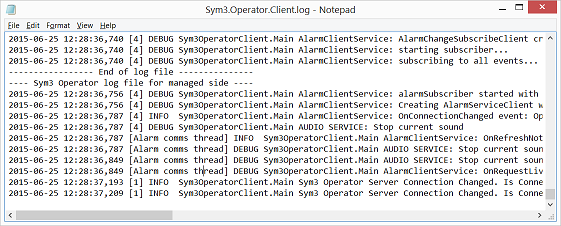
| Open Log File | Opens the Sym3.Operator.Client.log file in the default editor to view the contents. This file has lines appended with date and time stamp entries. (6) |
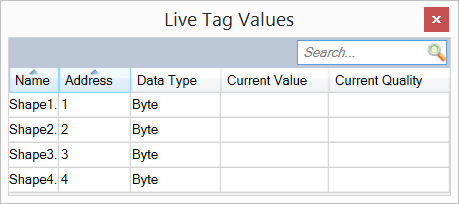
| Live Value | Display the Live Tag values and quality from the data sources. Simulated tags are working ONLY if a ‘dummy’ datasource is assigned to those simulated tags (Do not set DataSource to ‘None’ for those tags). For developers, examples of .NET code to display and set Tag values with WCF can be downloaded from the on-line support site. (7) |
| Exit | Closes the Diagnostic Toolbar AND the client. Use the X on the window to close just the Toolbar. |
| Output | Display any Debug output from the Client (8) |
(1)
(2)
(3)
(4)
(5)

(6)
(7)
(8)
Logs
The application logs are usually stored in ‘C:\ProgramData\Sym3\Sym3 Operator\Logs’ (Windows 8), other OS may vary.
The main log to use is ‘Sym3.Operator.Client.log’ but others may be available with configuration changes.
Adding JavaScript and ScriptEngine logs
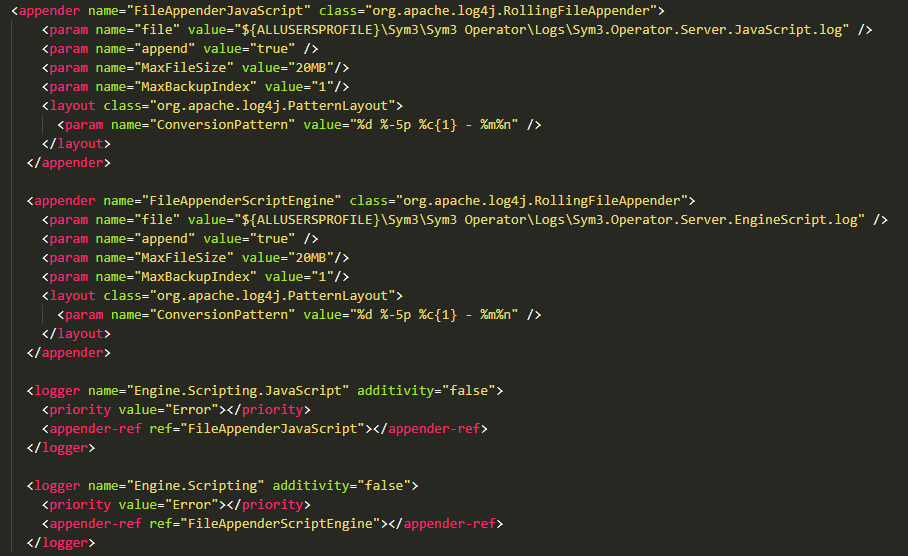
It is possible to add extra logging to track issues related to scripting. For example there are two further logs that will capture scripting information on Operator Server.
To add these logs , open the ‘BCS.Sym3.Operator.Server.log4cxx.config’ file that can be found in the ‘Program Files (x86)Sym3\Sym3 Operator\Server’ install directory.
Add the following XML appenders to the ones already there:
Note: click on the image to get the text:
