Debugging
📥 Download the Sym3 Visual Studio Code Extension
Debugging allows you to pause simulation script while it is running, look at the contents of variables and change them, and step over execution line by line. This makes it much easier to figure out why your script isn’t doing what you want it to. Debugging is performed from Visual Studio Code. See Edit With Visual Studio Code for more details on integrating Visual Studio Code with your project.
When the simulation is started, Sym3 opens the port configured in the debug settings and waits for connections. If the port is changed, the simulation must be started for the port to be changed.
Installing The Visual Studio Code Extension
In order to debug Sym3 projects, a Visual Studio Code Extension must be installed first. In order to install the extension, follow these steps:
- Download the latest extension.
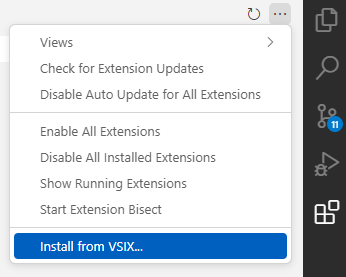
- Open the Extensions panel. In the top left corner of the panel, click the three dots and choose “Install from VSIX…”. Select the downloaded
sym3.vsixfile.
- When prompted, click “Restart Extensions”.
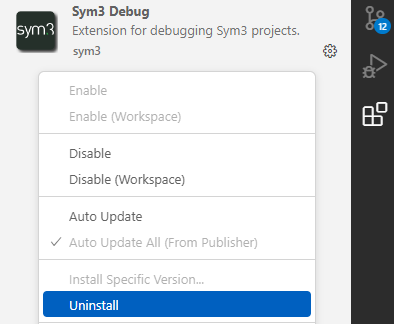
To update or reinstall the extension, simply follow those steps again. To uninstall the extension, click the gear next to the “Sym3 Debug” extension and click “Uninstall”.
Attaching
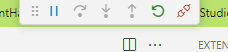
In order to debug Sym3, you have to ‘attach’ (connect) to it from Visual Studio Code, while the simulation is running. If debugging is enabled, when the simulation is running you should see an icon of a bug on the right of the simulation control bar:

If you do not see the bug, check the debug settings and ensure that debugging is enabled. Assuming everything is set up correctly, from Visual Studio Code with an appropriately set up launch.json (see Edit With Visual Studio Code and Settings for details) press F5, or choose Run and then Start Debugging. When an editor attaches to Sym3 the simulation bar will change color, to green.

If there were already breakpoints defined in the Visual Studio Code workspace, they will be automatically set. Otherwise breakpoints can now be set, and execution paused. To stop debugging, either click “Stop Simulation” from Sym3, or click the disconnect button at the top of the Visual Studio Code window.
Setting Breakpoints
You set breakpoints on specific lines of code. When Sym3 is about to execute that line of code, the simulation will be paused so you can inspect the simulation state.
Execution will be resumed either by clicking ‘continue’ in VS Code, or by resuming or stopping the simulation directly from Sym3.
You can set and delete breakpoints through VS Code. For more details, see the VS Code documentation on the subject.
Pausing And Resuming
When connected to Sym3, you can pause the simulation at any time by clicking the pause button in the debug interface.
If the simulation is paused (either because you paused it, or it has been paused by a breakpoint) then clicking the resume button on the debug interface will cause the project to start running again.
Inspecting Simulation State
When the program is paused you can observe the simulation ‘frozen in time’.
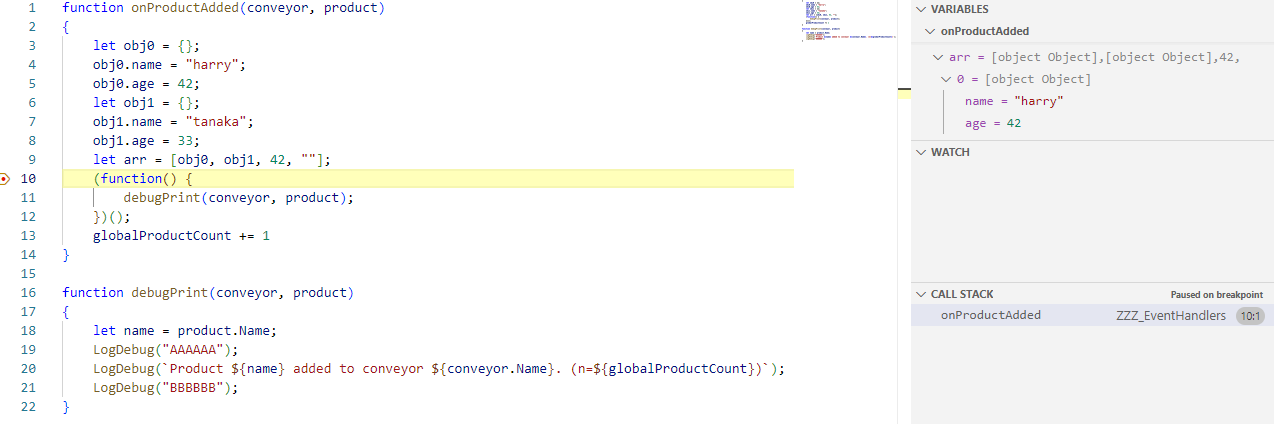
The line that is about to be run is highlighted. (That is, when execution is resumed that line will be run – it hasn’t been run yet.) The call stack section lists the functions that have been called to get to the current point. For example, if you have three functions, f1, f2, and f3, and f1 calls f2, and f2 calls f3, then you set a breakpoint in f3 the call stack will look something like:
CALL STACK
  f3        MainScript
  f2        MainScript
  f1        MainScript
In the variables section you will see a few scopes, which represent where variables visible to the current execution point are declared (locally, globally, etc). Some variables, like arrays and objects, contain variables inside them – you can view those ‘children’ variable’s values by clicking the arrow to the left of the ‘parent’ variable.
Evaluating Code & Changing Values
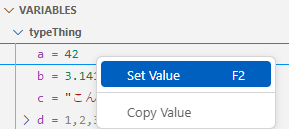
While the program is paused, you can evaluate code in the current context (see ‘Inspecting Simulation State’ above, for how the current context is determined). To set simple variables (numbers and strings), click on the variable value in the call stack, right click it selecting “Set Value”
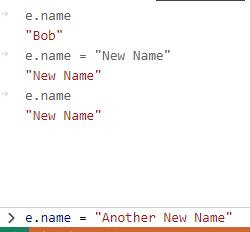
You can also evaluate code in the current context. In the “Debug Console” write the code to evaluate. For example, to check the value of an object named e’s name property, you can simply write e.name and hit enter (while the call stack that contains e is the active call frame). You can also set the value of name by writing something like e.name = "NewName" and hitting enter.
Stepping Through Code
When execution is paused in simulation script, you can ‘step’ through the code from the debug interface at the top of the window.
| Icon | Action | Shortcut | Description |
|---|---|---|---|
 |
Step Over | F10 | Execute the next statement, but do not enter any called functions. |
 |
Step Into | F11 | Execute the next statement, entering any called functions. |
 |
Step Out | Shift+F11 | Execute until the current function has been exited. |
Debugging Logical Processors
Debugging supports projects that use logical processors. Sym3 will pause and resume all processors (event and logical) at once – you cannot pause one processor while leaving the others running.
When you debug a project that uses logical processors, instead of getting a single call stack, you will see three.
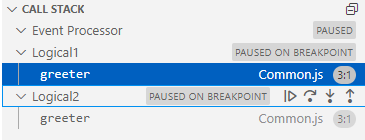
When the debugged simulation is paused, any processor that is running simulation script will be shown with a call stack. If a processor doesn’t have a call stack while the debugger is paused it means it’s not currently running any simulation script.
You can inspect the variables of each call stack by clicking on the individual call frames listed underneath each processor.
To resume, click continue like you would in single processor projects.